Executive summary and conclusions
A modern vision-language model can inspect a photograph and talk about it in useful detail. It can identify subjects, read visible text, describe relationships, compare similar frames, suggest search terms, and explain why one image may communicate more clearly than another.
That is real capability. It is not the same as seeing the photograph the way a photographer does.
The model does not receive a RAW file and experience light, color, timing, or intent. It receives a resized digital representation, divides it into visual tokens, and predicts language from patterns learned during training. That makes it a strong assistant for interpretation. It does not make it an exposure meter, a calibrated display, a provenance system, or a substitute for taste.
We then measured how this actually behaves on real hardware a photographer might own — a Pop!_OS Linux desktop with an RTX 5070 Ti (16 GB VRAM), a MacBook Pro M1 Max with 32 GB, and a $249, 18-watt NVIDIA Jetson Orin Nano appliance — using one benchmark harness, one photo corpus, and one set of production prompts. (Full machine spec sheets: Appendix A.)
Our conclusions
- AI is ready to assist photographic review, but not to own the verdict. It is good at naming what is visible and explaining likely relationships. It is less reliable when a judgment depends on exact focus, subtle color, hidden context, cultural meaning, or the photographer’s intention. Our quality lanes back this up with numbers: the small models that fit on everyday hardware rank photographs with only moderate agreement to a much larger reference model (Spearman ≈ 0.44–0.51 at n=86), which is useful for surfacing candidates and nowhere near strong enough to hand over keep/reject decisions.
- LrForge combines two kinds of evidence. Deterministic tools measure blur, clipping, face state, duplicates, and metadata. A vision-language model interprets subject matter, visual relationships, mood, searchability, and comparative strengths. Neither layer pretends to be the other. The deterministic layer is also nearly free: our measured pre-pass costs roughly a tenth of a second per photo on CPU alone.
- The newest or biggest model is not automatically the best LrForge model — and neither is the fanciest box. The single largest performance factor we measured was not hardware at all: the same 8-billion-parameter model on the same laptop ran 11–46× faster on one inference backend than another, because one backend silently forces a “reasoning” pass on every request. Backend configuration dominated hardware in our results. The cross-brand shootout sharpened the point: at the same size, brand mattered decisively — but through serving discipline rather than vision quality. Every non-Qwen small model we measured failed structurally (broken JSON, forced reasoning, or a crashed backend) before image judgment even entered the comparison, and a previous-generation model out-ranked its newer successor.
- Local AI is a product advantage, not merely an implementation detail. Photographers routinely work with family images, client work, unreleased products, private locations, and identifiable faces. Keeping analysis on the user’s own machine reduces unnecessary exposure of that material. The measurements show local is not a compromise: a laptop enriches and scores at ~1.2 s/photo, a desktop GPU at ~1.5–1.9 s/photo, and a $249 appliance enriches thousands of photos a night at 18 W.
- Always-on local AI is practical. The appliance tier survived a four-hour continuous max-load soak — 1,404 requests, zero failures of any kind, throughput dead flat, thermals plateaued ~22 °C under the limit. The desktop tier logged over 1,400 campaign requests with zero request failures (one shape-invalid response, caught by response validation).
- A useful benchmark uses photographs, not just charts and screenshots. Photographic judgment turns on near-duplicate selection, emotional ambiguity, subtle focus differences, mixed lighting, visible text, occluded faces, wildlife, events, documentary context, and honest uncertainty — so those are the cases worth testing. Our measured campaign covers speed, reliability, and score agreement; the observational lanes (hallucination, grounding, OCR, uncertainty) are still ahead.
- The honest promise stays modest and specific. What LrForge can fairly say is: “AI helps you inspect, compare, describe, and find photographs.” What it should not say is: “AI knows which photograph is best.” Our own data enforces the modesty: when we doubled the test corpus from 49 to 86 photos, the small models’ apparent ranking quality dropped noticeably — the flattering early numbers were a small-sample artifact, and we report the correction rather than the flattery.
The short version
Treat the model as a sharp second set of eyes with an unreliable memory and no personal history. Let it point things out. Let it explain its reasoning. Keep measurements visible. Keep the photographer in charge.
Treat the model as a sharp second set of eyes with an unreliable memory and no personal history.
The short versionThe question behind the benchmark
Most model reviews ask whether an AI can identify an object, solve a diagram, or read a chart. Photographers need a different test.
Can the model tell that one frame has the better expression while another is fractionally sharper? Can it distinguish deliberate motion blur from a missed shot? Can it notice a distracting hand at the edge without inventing a story about why it is there? Can it compare a burst without changing its standards halfway through?
Those questions sit between engineering and taste. That is where LrForge operates.
The goal is not to manufacture an automatic critic. The useful product is an evidence-aware assistant that reduces the mechanical work of review while leaving aesthetic authority with the person who made or owns the photographs.
How a model “sees” a photograph
The phrase “AI vision” makes the process sound more human than it is.
A vision-language model usually has three broad parts:
- A vision encoder turns an image into mathematical features.
- A projector or adapter maps those features into a form the language model can use.
- A language model predicts an answer from the image features and the user’s prompt.
Before any of that, the runtime normally resizes, tiles, crops, or otherwise prepares the image. Fine detail may survive, weaken, or disappear depending on the model and its image pipeline. The model never sees a 45-megapixel RAW file at native resolution the way a photographer inspects it at 100 percent.
The prepared image becomes visual tokens. These are not little captions. They are numerical representations of patches and relationships. The language model uses them as context when it produces text.
A helpful mental model is this: the AI converts the photograph into a dense set of clues, then writes the most plausible response to the question it was asked.
That explains both the magic and the mistakes.
Why prompts change the answer
Ask “Is this a good photo?” and the model has to guess what “good” means. It may reward bright color, centered subjects, smiling faces, conventional composition, or whatever patterns dominate its training.
Ask instead:
Compare these two frames. Report only observable differences in eye openness, subject separation, edge distractions, and apparent sharpness. Mark any judgment that cannot be made at this resolution.
The task becomes narrower and more auditable. Better prompting does not make the model infallible. It gives the model fewer opportunities to improvise.
Why the runtime changes the answer too
Our benchmark surfaced a less-discussed cousin of the prompting problem: the serving stack around the model can change its behavior as much as the prompt does. The same open-weight model, downloaded twice onto the same laptop, behaved like two different products depending on which local runtime served it — one runtime silently forced a chain-of-thought “reasoning” pass on every image request and could not be talked out of it; the other did not. The result was a 11–46× throughput difference and a measurable change in scoring behavior, from identical weights. The measured details are in the campaign section below. The lesson generalizes: when someone tells you how a model performed, ask what served it.
When someone tells you how a model performed, ask what served it.
Why the runtime changes the answerWhat it can do well for photographers
Describe and organize
Models can produce useful natural-language descriptions, candidate keywords, subject labels, visible-text transcriptions, and search phrases. This is especially valuable when a catalog has years of inconsistent metadata.
A useful description is not “a beautiful image capturing a vibrant moment.” That says almost nothing. A useful description is “three cyclists crossing a wet intersection at dusk, photographed from a low angle, with red brake-light reflections on the road.”
LrForge rewards concrete descriptions and suppresses generic praise.
Compare visible differences
A model can compare expression, gesture, occlusion, background clutter, subject placement, and narrative clarity across a small set of frames. It may explain why one frame reads more immediately than another.
This works best when the question names the evidence to inspect and the interface preserves the source frames beside the answer.
Read text inside photographs
Current models can read signs, packaging, jerseys, storefronts, screenshots, and documents with varying accuracy. That can enrich search and provide clues for event or location grouping.
OCR output still needs confidence handling. Decorative fonts, glare, perspective, low resolution, and partial occlusion remain hard.
Point to regions
Some model families support grounding or pointing: they can associate words with image regions or coordinates. This can make explanations more useful. “The distraction is near the upper-left edge” is easier to trust when the interface can show the referenced region.
Explain uncertainty
A model can be prompted to distinguish observations from interpretations and unknowns. This is one of the most important behaviors to benchmark. A model that says “the eyes may be soft, but the supplied preview is too small to verify” is more useful than one that confidently invents precision.
What it cannot safely decide alone
Exact sharpness
A model may recognize obvious blur, but exact focus evaluation belongs to deterministic analysis at an appropriate resolution. Preview scaling, compression, and the model’s own preprocessing can hide the difference between eyelashes in focus and the focus plane sitting on an ear.
Exposure and clipping
A model can describe an image as dark or bright. It cannot replace histogram, channel, RAW, or clipping measurements. A moody low-key portrait is not automatically underexposed. A pale sky is not automatically clipped.
Color accuracy
The model’s impression depends on the rendered pixels it receives. It does not know the display calibration, RAW interpretation, intended output medium, or the photographer’s target unless that information is supplied separately.
Authenticity and provenance
A vision-language model can notice visual anomalies. It cannot prove that an image is authentic or establish chain of custody. Provenance requires metadata, signatures, content credentials, source history, and other evidence.
Intent
The model sees the result, not the moment. It does not know whether blur was deliberate, whether a strange crop is part of a series, whether an expression matters to a family, or whether an imperfect frame is historically important.
A universal definition of “best”
There is no single best frame independent of purpose. The best news image, family keepsake, catalog image, portfolio piece, and stock submission may be five different photographs.
LrForge asks what the image is for before ranking it.
The measurements
What we measured: the benchmark campaign
The argument so far explains why photographic judgment is hard for AI. This section reports what happened when we put real models on real hardware and timed them. Everything below was measured in July 2026 with one harness, one corpus, and the production prompts LrForge actually uses; every number is re-derivable from the raw per-request JSON records published alongside this paper (see the reproducibility note at the end).
Method
-
Harness: one Python benchmark client (
tools/jetson_bench_matrix.py) drove every tier — wall-clock timing plus the server’s own token-throughput telemetry, response-shape validation, and strictly one request in flight per device. Same code, same photos, same prompts everywhere, with one disclosed deviation: the Ollama lane needed a raised token budget to complete at all (details in the backend section). - Corpus: 86 local photos from real shoots, deliberately salted with a handful of screenshots, logos, and AI renders. The salt is disclosed wherever it moves a number. Quality lanes were first run on a 49-photo analyzed subset, then extended to all 86.
- Tasks: the four things LrForge asks of a model in production — a 0–10 score in JSON, five keywords, a one-line caption, and the combined production prompt (score + composition + focus + description + keywords in one JSON response, 512 px input, 220 max tokens).
- Honesty rules: cold-start and steady-state are reported separately; repeat-lap runs that benefit from server-side caching are disclosed and paired with cold-corpus numbers; failures are counted, not hidden; and because device and model change together across tiers, the results are deployment tiers, not a hardware shootout. No cell below compares chips; each compares a way a photographer could run LrForge.
The three deployment tiers
| Tier | Hardware | Model | Engine |
|---|---|---|---|
| Desktop GPU | Pop!_OS Linux desktop — RTX 5070 Ti (16 GB VRAM), Ryzen 7 7800X3D, 32 GB RAM | Qwen3.6-35B-A3B (4-bit) | llama.cpp |
| Appliance | NVIDIA Jetson Orin Nano Super, 8 GB, ≤18 W, $249 | Qwen3.5-4B (4-bit) + vision projector | llama.cpp |
| Laptop | MacBook Pro — Apple M1 Max, 32 GB | Qwen3-VL 8B and 4B | Ollama and LM Studio (both measured) |
This first campaign deliberately stays inside one model family (Qwen) so that the tier story is not confounded by brand differences on top of everything else. A same-size cross-brand comparison was then measured on the laptop tier — see “Does brand matter at the same size?” in the quality section. Full hardware and software configurations for all three machines are in Appendix A at the end of the paper.
Throughput: every tier is fast enough to matter
Figure 1 shows steady-state seconds per photo on the combined production task — the full LrForge enrichment pass — for each measured lane.
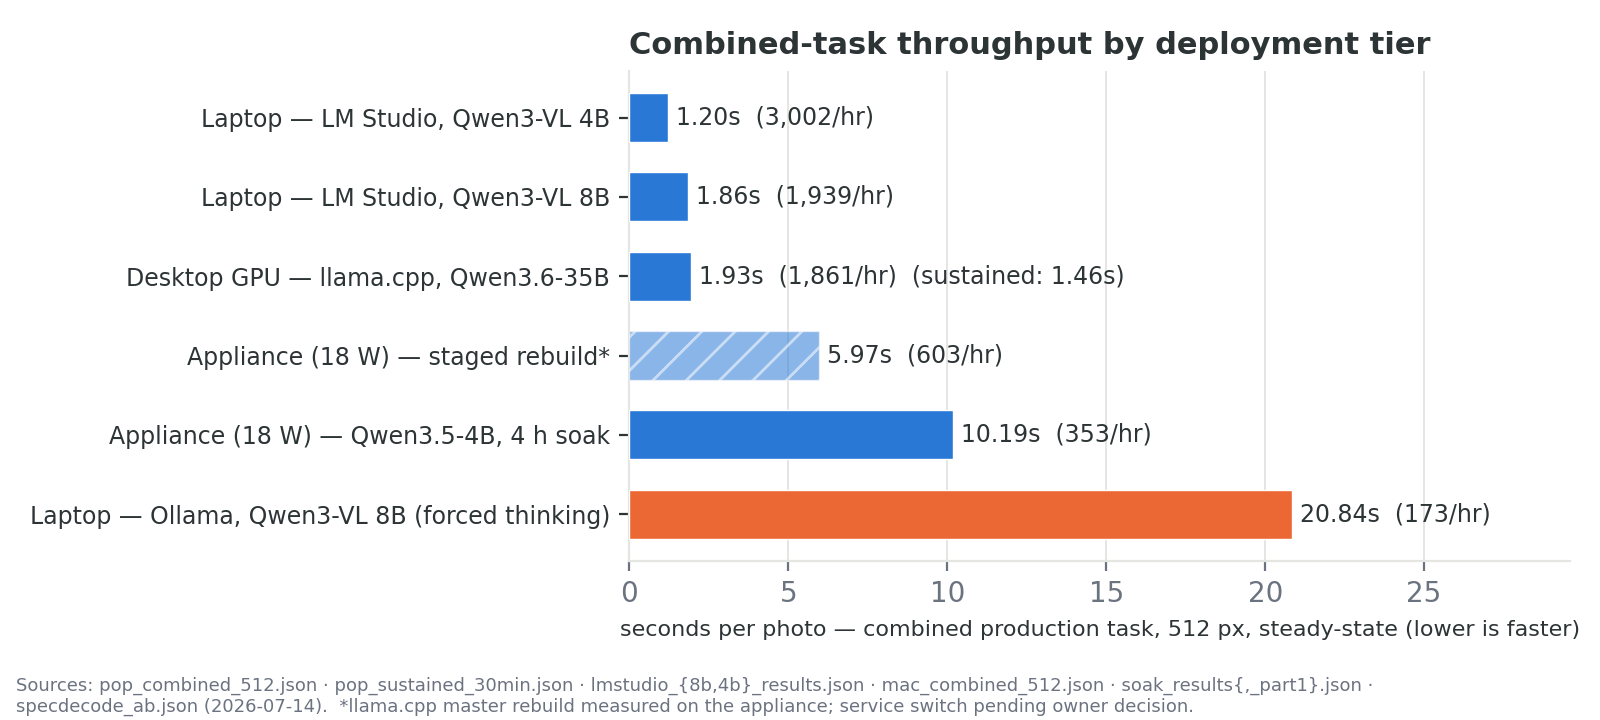
Headline numbers, steady-state, 512 px combined task:
- Laptop, LM Studio, Qwen3-VL 4B: 1.20 s/photo (~3,000/hour). The best measured price/performance enrichment lane in the campaign — the photographer’s existing laptop, no extra hardware.
- Laptop, LM Studio, Qwen3-VL 8B: 1.86 s/photo.
- Desktop GPU, 35B model: 1.93 s/photo on the standard lane; 1.83 s/photo cold-corpus across all 86 unseen photos (~1,960/hour) and 1.46 s/photo sustained in a 30-minute continuous run (~2,460/hour, ~19,700 per 8-hour night). The sustained figure benefits from re-serving the same images across laps (server-side caching), which is why we quote the cold-corpus number beside it.
- Appliance: 10.2 s/photo sustained over a 4-hour soak (~350/hour, ~2,800 per 8-hour night at 18 W). A staged llama.cpp rebuild on the same box — newer CUDA kernels plus the reasoning template properly disabled — measured 5.97 s/photo (+60% throughput) in an A/B test, and a follow-up side-by-side (12 photos, both binaries live: 10.11 → 6.18 s/photo, 128 → 87 generated tokens) confirmed the leaner output is overhead, not content — the rebuild’s descriptions are actually longer and more specific. The service was switched to the rebuild on 2026-07-14 (post-switch live check: 6.7 s/photo, zero leaks), so the appliance’s production rate is now the rebuilt figure — the soak and matrix numbers quoted here were measured on the earlier build and are labeled as such.
- Laptop, Ollama, Qwen3-VL 8B: 20.8 s/photo (~173/hour) — the same 8B weights as the 1.86 s LM Studio lane. See the next subsection.
Two structural findings sit behind the table. First, image prefill (the model’s one-time ingestion of the image and prompt before it starts writing) is not the bottleneck on any tier — the gap between tiers is generation speed (~65 tokens/s on the production task on the desktop GPU versus ~14 on the appliance), so the gap grows with output length: the appliance is only ~2× slower on the terse score task but ~5× slower on the verbose combined task. Second, the single-task lanes are far cheaper than the combined lane everywhere (desktop: score 0.58–0.77 s, keywords 0.57–0.84 s, caption 1.1–1.2 s across 256–1024 px; appliance: score 1.05–1.6 s, keywords 1.8–2.9 s, caption 3.7–4.7 s), and resolution costs surprisingly little — 512 px, LrForge’s production resolution, costs at most ~17% (~0.1 s) over 256 px on the desktop’s sub-second tasks, cheap next to the value of the extra resolution.
The backend finding: configuration dominates hardware
The largest single effect in the whole campaign was not a model or a machine. It was a default setting.
Ollama’s build of Qwen3-VL 8B forces a chain-of-thought “reasoning” pass on
every request, and no documented switch disables it — think:false,
reasoning_effort:none, and /no_think were all silently ignored in
our tests. Every photograph pays a hidden tax of hundreds to thousands of reasoning tokens
before the first useful character of output. LM Studio serving the same weights on the
same laptop does not force thinking.
Figure 4 shows the consequence, task by task:
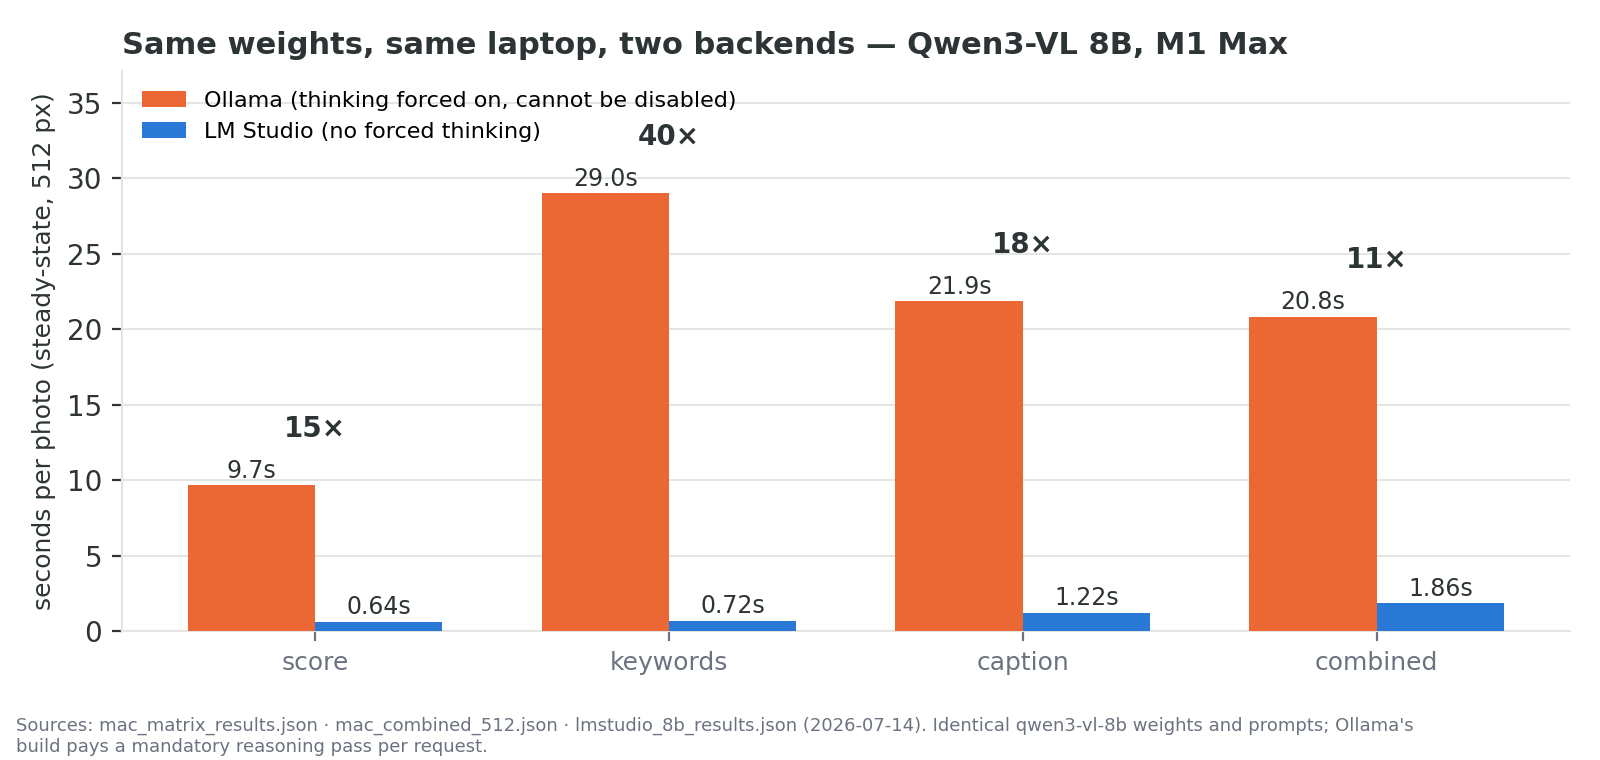
| Task (512 px, steady) | Ollama 8B | LM Studio 8B | Ratio |
|---|---|---|---|
| score | 9.7 s | 0.64 s | 15× |
| keywords | 29.0 s | 0.72 s | 40× |
| caption | 21.9 s | 1.22 s | 18× |
| combined | 20.8 s | 1.86 s | 11× |
Across the full matrix the spread runs 11–46×, worst on keyword tasks the model loves to overthink (we logged reasoning transcripts past 6,500 characters for five-keyword requests, including one 8,014-character runaway that exhausted its token budget and returned nothing). One protocol deviation, disclosed: the Ollama lane ran with a raised 1,024-token budget instead of the protocol’s 220, because at 220 tokens every request truncated mid-reasoning and the lane’s failure rate would have been ~100% — a concession made in Ollama’s favor, and the 11–46× gap is measured with it. The forced thinking also hurt scoring: the Ollama lane compressed most photos into a generous 6–9 band and posted the worst ranking agreement of any lane (details below).
This is a thesis-supporting finding, and it is why this paper keeps insisting that a model
name on a leaderboard tells you little. The same weights were simultaneously the slowest and
among the fastest configurations we measured, depending entirely on the serving stack. A
related, smaller instance of the same lesson appeared on the appliance: its stock chat
template leaked a stray </think> tag into most responses under load (a
template artifact, neutralized by a one-line client-side strip that production LrForge ships),
and the staged rebuild that disables the reasoning template at the source was worth +60%
throughput on identical hardware and weights. One more strip-related footnote from the
cross-brand lanes: the reasoning delimiter itself is not standardized — Moonshot’s
Kimi-VL wraps its chain-of-thought in ◁think▷…◁/think▷
rather than the usual <think> tags — so a production reasoning-strip
has to match more than one vocabulary, not just the one its authors have already seen.
Reliability: always-on local AI holds up
A culling assistant that crashes at photo 800 of a wedding is worse than none. So we soaked the weakest tier hardest.
Figure 3 shows the appliance’s four-hour continuous max-load soak — combined-task enrichment, no think-time between requests, shuffled 86-photo laps:
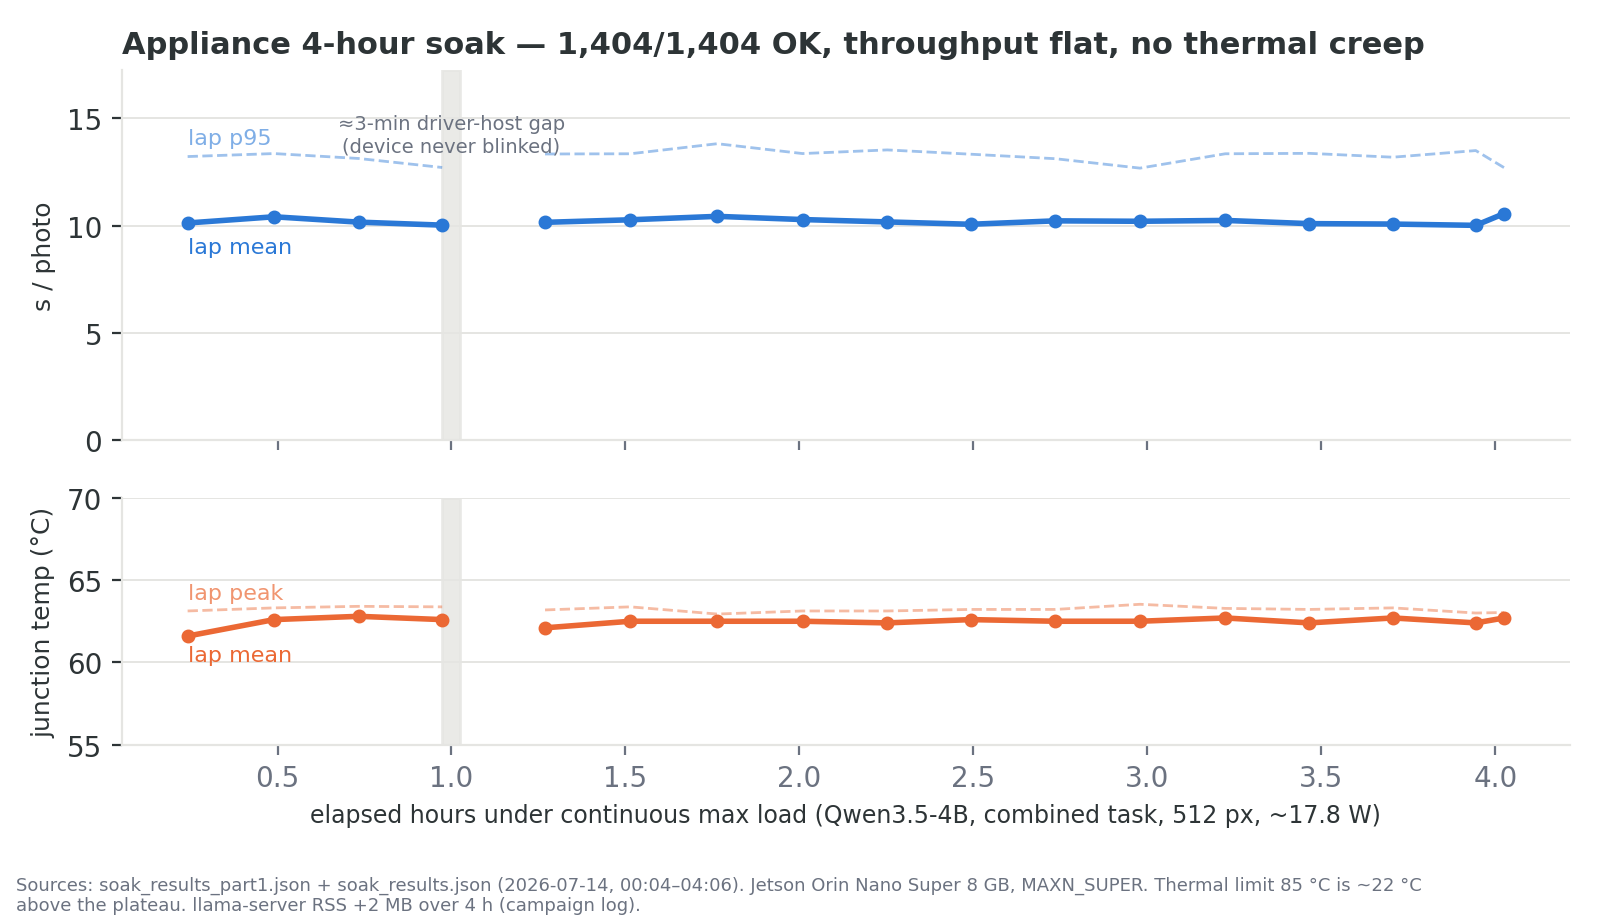
- 1,404 requests, 1,404 OK — zero parse failures, zero HTTP errors, zero timeouts, zero retries, zero truncations.
- Throughput dead flat: 17 laps, lap means 10.0–10.6 s/photo; hour four matched hour one. The lap p95 (the time under which 95% of that lap’s requests finished) is the dashed line in Figure 3 and stays just as flat. No thermal throttle events.
- Thermal plateau: junction temperature held ~62–63 °C all run (lap means 61.6–62.8 °C, peak 63.5) — roughly 22 °C of headroom — at a steady 17.7–17.8 W.
- No memory leak: the inference server’s resident memory grew 2 MB over four hours; an apparent system-memory creep in device telemetry turned out to be OS page cache.
- Honesty note: the run was split into a 1-hour and a 3-hour segment by a ~3-minute restart (188 s) of the driving machine, logged and visible in the figure; the appliance itself never blinked.
- The template artifact appeared in 1,127 of 1,404 responses under load and was neutralized by the client-side strip in every single case.
The other tiers matched the standard: the desktop GPU closed the campaign at over 1,400 requests with zero request failures — no HTTP errors, no timeouts, no retries across matrix, combined, 30-minute sustained, and 86-photo reference lanes — and exactly one shape-invalid response in those 1,427 requests (a keywords request answered in caption shape), flagged by the harness’s own response validation rather than slipping through. The LM Studio laptop lanes ran 175 requests, likewise zero request failures with one shape-invalid response caught the same way. We count those two validation catches as the trust architecture working, not as blemishes: a scoring pipeline that notices when a model answers in the wrong shape is exactly what a photographer should demand. The one systemic failure mode we observed anywhere was the Ollama thinking runaway noted above — a backend behavior, not a hardware one. Recovery is also quick where it matters: a full service restart on the appliance reached its first completed vision inference in 12.5 seconds.
For a product that wants to run overnight enrichment while the photographer sleeps, these are the numbers that matter: the appliance projects to ~8,500 fully-enriched images per 24 hours as-is at 18 W (~14,000+ after the staged rebuild), and the desktop GPU to ~19,700 per 8-hour night.
Quality: how closely do small models agree with a big one?
Speed without judgment is just a fast way to be wrong, so the campaign’s quality lanes asked a narrow, honest question: when a small local model scores photographs 0–10, how well does its ranking agree with a 35B-parameter reference model scoring the same photographs with the same prompt?
Speed without judgment is just a fast way to be wrong.
The quality lanesTwo things must be said before any number. First, the reference is a bigger model’s opinion, not human ground truth — a Phase-2 calibration against a real photographer-culled shoot is the standing gap. Second, the corpus is deliberately salted with non-photographs (screenshots, logos, AI renders), and the salt turns out to matter.
Figure 2 shows ranking agreement (Spearman correlation) with 95% bootstrap confidence intervals, on both the original 49-photo subset and the full 86-photo corpus, including the cross-brand lanes measured later in this section:
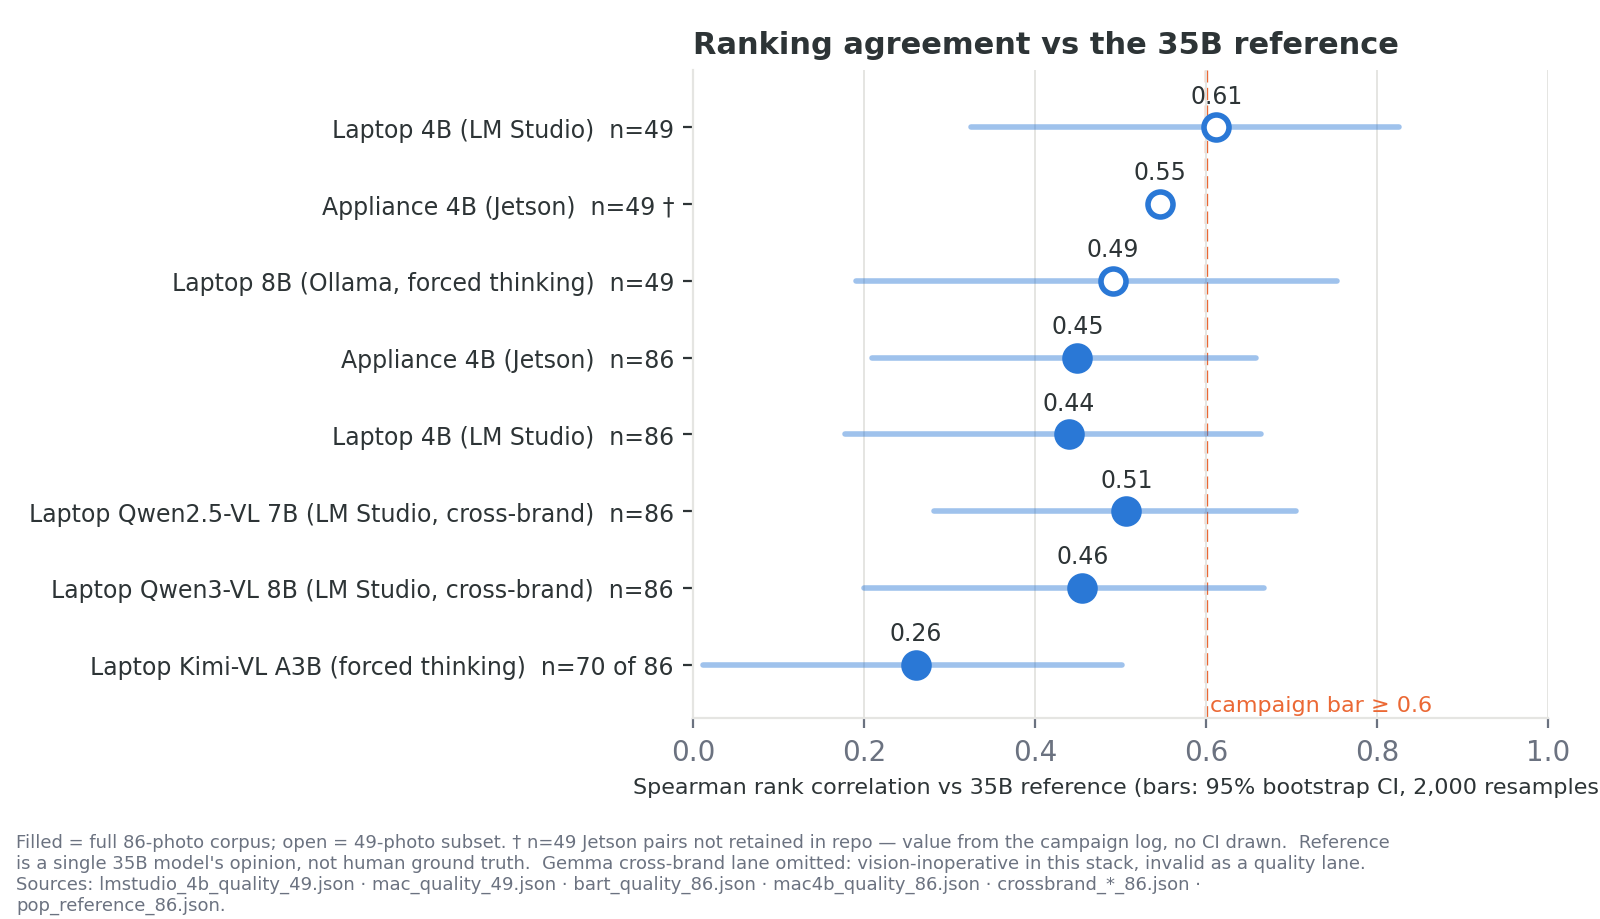
| Lane | Spearman, n=49 | Spearman, n=86 | Top-10 keeper overlap, n=86 | MAE (mean absolute score error, 0–10 points), n=86 |
|---|---|---|---|---|
| Appliance Qwen3.5-4B | 0.546 | 0.449 [0.21, 0.66] | 5/10 | 2.02 (scores ~1.4 pts harsher) |
| Laptop Qwen3-VL 4B (LM Studio) | 0.612 [0.32, 0.83] | 0.439 [0.18, 0.66] | 5/10 | 1.78 (scores ~1.2 pts generous) |
| Laptop Qwen3-VL 8B (Ollama, forced thinking) | 0.491 [0.19, 0.75] | — | (n=49: 4/10 strict, 5/10 counting ties) | (n=49 MAE 1.39, +1.2 generous) |
The campaign set two pre-registered bars: Spearman ≥ 0.6 and top-10 keeper overlap ≥ 6/10. At n=86, both 4B lanes miss both bars.
The n=86 correction — the most important honesty item in this paper
At n=49, the laptop 4B looked like a headline: Spearman 0.612, first lane over the bar. At n=86 it fell to 0.439. The appliance lane fell the same way (0.546 → 0.449). The early numbers were small-sample flattered, and the wide bootstrap intervals were the warning sign in plain view: with 49 photos, the intervals were so wide that no lane could be statistically separated from any other. We report the corrected picture, not the flattering one:
How big is a fall from 0.61 to 0.44, really? On paper it reads dramatic — about 28% lower. The honest reading is subtler. The n=86 confidence interval [0.18, 0.65] still contains the old 0.612, so the two measurements cannot be statistically told apart: the careful measurement did not reveal a worse model, it revealed how imprecise the first measurement was. Think of measuring the same sheet of paper twice — once quickly (0.61), once carefully with the error band shown (0.44 ± a wide margin). Where the correction is actually felt is not the correlation but the picks: top-10 keeper overlap fell from 6–7 in ten to 5 in ten — one to two more wrong “best shots” in every ten the model surfaces, which a photographer culling a wedding would notice. And the reason the fall matters despite the overlap: the bars (0.6 and 6-of-10) were set before measurement. 0.612 tickles the bar; 0.44 clearly misses it. Your fingers cannot tell a 0.44 mm sheet from a 0.61 mm one, but a spec that says “at least 0.6” can — and claiming a pass off the lucky sample is exactly the kind of overclaim this paper exists to avoid.
- The two 4B lanes converge (0.44–0.45) across totally different devices, engines, and even model lineages within the family. That convergence is a validity check worth more than either headline: model class, not hardware, sets ranking quality.
- 4B-class verdict: human-in-the-loop assist only. Top-10 overlap of ~50% still surfaces real keepers — genuinely useful for pointing a photographer at candidates — but nothing in this class should auto-reject a photograph unsupervised.
- The Ollama 8B lane’s poor showing (0.491, 4/10 keeper overlap at n=49 — worse than the 4B lanes despite double the parameters and 10× the latency) is not a “bigger model loses” story; it is the forced-thinking configuration compressing scores into a 6–9 band and damaging discrimination. It is one more entry in the backend-dominates file. The 8B non-thinking lane at n=86 has since been measured — see the cross-brand shootout below.
- The largest individual disagreements in both 4B lanes are all salt — but in opposite directions. The appliance 4B is harsh on salt the 35B liked: its ten biggest misses are screenshots and logos it scores 1–3 that the 35B scores 7–9. The laptop 4B is generous on salt the 35B hated: its ten biggest misses are screenshots it scores 5–8 that the 35B scores 1–3 (consistent with that lane’s overall +1.2 generous bias). In both lanes the ten biggest misses are 100% non-photographs. That is a rubric split — “is this a good image?” versus “is this a good photograph?” — and no model in the study applies it consistently, including the reference: the 35B scores some screenshots 8–9 and other near-identical ones 1–2, in one case giving a duplicate pair of the same screenshot a 2 and an 8. We disclose all of this because the salt moves the correlation, in the small models’ disfavor.
- On the core job the 35B reference behaved like a usable reference: across all 86 photos it produced a real score spread (seven 1s through five 9s, mean 5.57) with zero parse failures and zero request failures at 1.83 s/photo. Its inconsistent salt scoring, noted above, is the caveat: it is a usable ranking reference for photographs, not a rubric-consistent judge of non-photographs.
Does brand matter at the same size?
Everything above deliberately stayed inside one model family, which left an obvious question open: was any of this Qwen-specific? So the campaign closed with a cross-brand shootout — same laptop (M1 Max, LM Studio), same 86-photo corpus, same production combined prompt, same 35B reference, one model loaded and strictly one request in flight — across small vision models from four brands.*
| Lane (brand) | Thinking | s/photo (mean / p50 / p95) | Malformed | Spearman [95% CI] | Top-10 | MAE |
|---|---|---|---|---|---|---|
| Qwen2.5-VL 7B (Alibaba, previous generation) | non-thinking | 2.22 / 2.00 / 3.19 | 0/86 | 0.507 [0.29, 0.72] | 6/10 | 1.28 |
| Qwen3-VL 8B (Alibaba) | disabled and verified — 0 reasoning characters in 86/86 | 1.82 / 1.66 / 2.63 | 0/86 | 0.455 [0.22, 0.67] | 6/10 | 1.38 |
| Kimi-VL A3B Thinking (Moonshot, ~3B active) | forced — cannot be disabled; ran at a raised 2,048-token budget, a disclosed protocol deviation | 8.79 / 8.40 / 12.87 | 16/86 | 0.261 [0.01, 0.52] (n=70) | 6/10 | 1.90 |
| Gemma 4 26B-A4B (Google, ~4B active) | n/a | 30.0 / 8.3 / 87.7 | 75/86 | −0.140 [−0.35, 0.07] (salvaged — lane invalid as a vision measurement) | 1/10 | 2.70 |
* Two further planned lanes never produced data and are disclosed rather than dropped: an alternate Gemma 4 26B-A4B build (LM Studio’s resource guardrail refused the 21.8 GB load on the 32 GB machine) and Llama 3.2 11B Vision (its MLX backend crashed with a tensor-shape error on consecutive requests — a first request could succeed; the next killed the model process). Logged, not scored. The three valid lanes are plotted with their confidence intervals in Figure 2 above; the Gemma lane is omitted from the figure for the reason its row states.
Brand mattered decisively — and not in the way a leaderboard reads. The differentiator was not vision IQ; it was engineering discipline. All three measured Qwen lanes (2.5-VL 7B, 3-VL 8B, and the 4B laptop lane above) ran clean: non-thinking, 100% parseable JSON, one to two seconds per photo, Spearman 0.44–0.51. Every non-Qwen brand failed structurally before quality could even be assessed. Gemma’s lane was functionally blind despite the runtime flagging the model vision-capable: its descriptions were unrelated to the actual photographs, eleven different photos received a byte-identical response, 69 of 86 scores were exactly 8, and 75 of 86 responses broke strict JSON — the score row above was regex-salvaged purely to quantify the blindness and must not be read as a quality measurement. Kimi’s un-disableable reasoning ran away past the token budget on 19% of its responses before any JSON appeared. Llama’s serving path crashed outright. Choosing a small local model, on this evidence, is less about which brand “sees” better and more about which one reliably completes the job as served — the paper’s backend thesis again, this time wearing brand clothing.
Two honest caveats. This is a single laptop and a single runtime: the Gemma and Llama failures may be integration bugs in this serving stack — Gemma’s blindness in particular may sit partly in the runtime’s vision path for this model rather than in the weights — and their native stacks might behave differently. We keep the rows anyway, because the stack we measured is the stack a photographer with this laptop would actually use, and the failure is real for them either way. The Kimi numbers also carry a selection effect: the 16 responses that hit the token cap mid-reasoning are missing from its statistics, so its interval is wider and its point value slightly flattered.
Among the lanes that worked, one result deserves its own sentence: the previous-generation Qwen2.5-VL 7B matched or edged its successor Qwen3-VL 8B (0.507 versus 0.455, confidence intervals overlapping) — a measured counter-narrative to “newer is better.” The same lane closes the open 8B question from the Ollama section: on equal non-thinking serving terms at n=86, 8B lands in the same band as the 4B lanes, not above them. And no small model of any brand crossed the 0.6 Spearman bar. The assist-only verdict extends from the 4B class through the 7–8B class: every one of these models is a candidate-surfacer that can make a photographer faster, and none of them is a judge.
The deterministic pre-pass, measured
The trust architecture below says “measure what can be measured before asking a model anything.” The campaign put a cost on that layer: on a laptop CPU alone (no GPU, no model), perceptual-hash burst dedupe runs at ~15 images/s and real face/eye-state analysis at ~23 images/s — about 108 ms per photo combined. A 10,000-frame wedding pre-passes in roughly 18 CPU-minutes before a single model token is generated, flagging duplicates, blinks, and measurable defects for free next to VLM costs. (Timing measured on an 82-photo pass of the corpus — four fewer files than the model lanes’ 86; the per-photo cost is the quantity of interest and does not depend on the exact file count. This corpus has no true burst near-duplicates, so dedupe drop behavior is validated by the unit and chaos test suites rather than this timing lane. Like the other pre-pass numbers, this timing is a campaign-log figure — see Reproducibility.)
Beyond scoring: the layered engine runs end-to-end
The benchmark campaign measured the model layer. A separate end-to-end validation, run against a live Lightroom test catalog, exercised the layers above it, and three results matter here. The taste-learning layer completed its full loop — cull, real Lightroom pick flags, catalog read-back, training — and on photos held out from training it recalled every keeper with no false alarms (recall 1.0, average precision 1.0, Brier score 0.041 — a 0-is-perfect measure of whether its confidence numbers can be taken at face value); it also passed a two-condition honesty check, refusing to train when fed a deliberately unlearnable random “style” and learning when fed a real pixel-correlated one. The develop-suggestion layer beat a predict-the-average baseline on 7–8 of 8 sliders, with 95–98% of predictions inside tolerance, and it is propose-only by construction — no code path exists that could apply a slider. Finally, a live overnight run over 49 photos produced a 14-keep / 35-reject approval manifest — per-photo keep probability, reasons, and develop proposals — with zero errors and, again, nothing applied without the photographer.
Two honesty notes. The taste labels were model-derived, so these are plumbing-and-learnability proofs, not proof the system has learned a human’s taste (Limitations #7). And these numbers come from the end-to-end validation reports, not from this benchmark’s published raw records (see Reproducibility); they are included because they show the architecture the rest of this paper argues for actually runs, end-to-end, on a real catalog.
The July 2026 model field
This is a research shortlist, not a declaration of LrForge support. Each candidate still needs runtime validation, license review, memory profiling, output-quality testing, and integration work. The measured campaign above deliberately stayed inside the Qwen family across its tiers; this table is the wider field those results will be tested against; the first cross-brand results are in the quality section above.
| Model family | July 2026 position | Why it matters for culling | Main caution | Suggested benchmark lane |
|---|---|---|---|---|
| Qwen3.5 / Qwen3.6 | Unified multimodal Qwen family; dense and mixture-of-experts sizes from compact models through server class | Strong general candidate for image understanding, text reading, reasoning, and local-to-server scaling — and now the measured backbone of our tier campaign (35B desktop reference, 4B appliance, VL 8B/4B laptop) | Runtime support and practical memory use vary sharply by size and quantization; template defaults can leak reasoning tags (measured) | Primary quality lane |
| Gemma 4 | Google’s current multimodal Gemma family (E2B through 31B variants) | Important local model family with image support across a broad size range; attractive for privacy-first deployment | New runtime paths and quantizations need real validation; model-card capability does not guarantee LrForge backend compatibility — measured in practice: our first Gemma lane (26B-A4B on the Mac LM Studio/MLX stack) arrived vision-inoperative (quality section) | Primary local lane, especially E4B and 12B-class candidates |
| MiniCPM-V 4.6 | Compact 1.3B edge model (SigLIP2-400M vision encoder + Qwen3.5-0.8B backbone; released May 11, 2026; verified against the model card 2026-07-14) | A serious speed and memory candidate for laptops and lightweight always-available analysis | Small models may sound fluent while missing subtle photographic evidence — and our n=86 result shows even 4B-class models are assist-only | Efficiency lane and low-memory baseline |
| Phi-4-Reasoning-Vision-15B | Microsoft’s compact open-weight multimodal reasoning model | Interesting for structured comparison and explanations that separate observations from conclusions | Reasoning length increases latency — our Ollama lane shows how expensive always-on reasoning is; it must be optional and bounded | Deliberate reasoning lane |
| Molmo 2 4B | Ai2’s compact multimodal research model with pointing and tracking strengths | Pointing and multi-image behavior map well to explainable culling and comparison | Research-oriented packaging; runtime availability less turnkey | Grounding and multi-image lane |
| Qwen3-VL | Mature, well-supported Qwen vision-language family | Known reference point; now carries measured laptop-tier numbers in this paper | No longer the newest Qwen family | Control model and measured laptop baseline |
| InternVL3.5 | Strong 2025 open multimodal family | Useful independent architecture for checking whether Qwen results generalize | Older than the 2026 families; less convenient runtime path | Independent comparison lane |
| Llama 4 Scout/Maverick | Meta’s natively multimodal open-weight family | Useful external reference for large-model capability | Too large or operationally expensive for many photographers’ local machines | Server-class comparison only |
| SmolVLM family | Established small open VLM family | Useful floor for memory-constrained testing | Not a serious candidate for subtle photographic review | Small-model control |
The winning model earns its place on real photographs and real culling tasks — not on a general leaderboard. And as the campaign showed, it earns it as served: the runtime and its defaults are part of the candidate, not a footnote.
The LrForge trust architecture
A trustworthy photography assistant should preserve the difference between measurement and interpretation.
Layer one: deterministic evidence
Conventional image processing and metadata tools handle facts that can be measured:
- blur and local sharpness signals
- highlight and shadow clipping
- duplicate and near-duplicate similarity
- face presence, eye state, and occlusion signals
- dimensions, timestamps, lens, exposure settings, and other metadata
- file integrity and provenance data when available
These systems can still be wrong, but their outputs are bounded and testable. And they are cheap: the measured pre-pass costs ~108 ms per photo on CPU alone.
Layer two: visual interpretation
The vision-language model takes on questions that benefit from language and context:
- What is happening in the frame?
- Which visible differences matter for this stated purpose?
- What keywords would help someone find this image later?
- Is there a background distraction that a simple metric missed?
- Which frame communicates the requested idea more clearly?
- What can and cannot be concluded from the supplied preview?
Layer three: the photographer’s decision
The interface exposes evidence rather than hiding it behind a score. A recommendation carries a short reason and, where possible, a visual reference to the region that influenced it.
The photographer accepts, rejects, or changes the recommendation. That feedback can improve workflow without turning personal taste into an invisible universal rule.
Which LrForge feature needs which model skill
LrForge is not one AI feature. It is a set of features, and each one leans on a specific model capability — or deliberately on none. Mapping them makes two things clear: the benchmark tests the skills the product actually uses, and you can see exactly where the model is load-bearing and where it is not.
The middle column lists models whose model cards claim the skill. That is support, not proof. How well each one performs is what the benchmark measures, one lane at a time.
| LrForge feature | Model skill it depends on | Models that support the skill (from model cards; quality still to be measured) | Benchmark lane |
|---|---|---|---|
| Auto-keywords and metadata enrichment | Description plus subject and label recognition | Universal across the roster; any capable general describer | Quality — throughput measured this campaign on all three tiers |
| AI vision search (“show me the sunset shots”) | Image understanding turned into a searchable description | Universal multimodal comprehension | Quality |
| Text-in-photo search and event grouping | OCR and text reading | Qwen3-VL and Qwen3.5, InternVL3.5, Gemma 4; small models such as SmolVLM are the weak end | OCR (ahead) |
| Burst and near-duplicate comparison | Multi-image comparison with stable standards across frames | Molmo 2 (multi-image), Qwen3-VL, InternVL3.5 | Burst comparison (ahead) |
| Distraction and region callouts (“hand at the upper-left edge”) | Grounding and pointing: associating words with image regions | Molmo 2 (explicit pointing and tracking), Qwen vision-language grounding | Grounding (ahead) |
| Structured cull reasoning that separates observation from conclusion | Multi-step reasoning over the image | Phi-4-Reasoning-Vision-15B | Deliberate reasoning (ahead) |
| “Not enough evidence” honesty | Calibrated uncertainty | Mostly a prompting and evaluation property, not a fixed model trait; benchmarked per model, not read off a card | Uncertainty calibration (ahead) |
| Blur, clipping, eye-state, and duplicate detection | None — deterministic image processing | Not applicable; deliberately not a model skill | Deterministic layer — measured: ~108 ms/photo on CPU |
The last row is the whole point of the architecture. Some LrForge features are trustworthy precisely because they do not depend on the model. The rest depend on skills the benchmark can measure lane by lane. That is why the useful output is a winner named by job, not a single leaderboard number.
Known limitations
Stated here, in their own section, because a benchmark you can trust is one that shows you its edges.
- Tier comparisons confound device and model. The desktop ran a 35B model; the appliance a 4B; the laptop 8B/4B. That is deliberate — each tier is a realistic deployment, not a controlled hardware variable — but it means no number in Figure 1 isolates hardware. The one clean controlled comparison in the campaign is the backend A/B (same weights, same machine, Figure 4).
- The quality reference is a single 35B model’s opinion, not human ground truth. Agreement with it measures consistency across model scales, not correctness. Phase-2 calibration against a real photographer-culled shoot (~150+ frames with actual keep/reject decisions) is the standing gap, and it gates any stronger claim.
- The corpus is small and salted. 86 photos (49 in the first-pass lanes), deliberately including screenshots, logos, and AI renders. The salt materially moves the correlation numbers (documented above), and n=86 is still small — the bootstrap intervals in Figure 2 are wide, and the n=49 → n=86 correction shows exactly how much small samples flattered.
- Sustained throughput numbers partly reflect caching. Repeat-lap runs re-serve the same images, which flatters steady-state means; cold-corpus numbers are quoted alongside everywhere it matters (desktop: 1.83 s cold-corpus vs 1.46 s sustained).
- The appliance’s stock template leaks reasoning tags on a majority of responses under load. Production LrForge neutralizes it client-side (validated 1,127/1,127 under soak); the root fix is a server-side template configuration, measured (+60% throughput, richness verified) but not yet switched into service. One watch-item from the richness side-by-side: the rebuilt configuration is more proper-noun-eager in descriptions, which occasionally over-reaches (one wrong-adjacent franchise keyword in twelve photos) — a net positive for search and cataloging, but a reminder that specificity and hallucination are neighbors.
- The observational lanes are still ahead. Hallucination rate, comparative consistency, OCR accuracy, grounding, and uncertainty calibration — the photograph-set benchmark described in the companion study design — have not yet been scored. This paper’s measured claims are limited to throughput, reliability, and score agreement.
- The engine-capability proofs used model-derived labels. The 3.0 taste results demonstrate plumbing and learnability, not that the system has learned a human’s taste.
Our promise
Here’s our promise — and here’s the claim we deliberately refuse to make:
What we’ll say
LrForge takes the tedious part of culling off your plate. It measures what can be measured — sharpness, exposure, duplicates — and uses AI on your own machine to describe and compare your shots so they are fast to sort and find. It shows you why it flagged each photo, and every keep-or-cut call stays yours.
What we won’t
LrForge’s AI understands your photographs and automatically chooses the best ones.
We refuse to make that second claim because it compresses several uncertain systems into a promise they cannot reliably keep. The measurements in this paper are why: the models are fast enough, reliable enough, and useful enough to assist — and demonstrably not consistent enough to own the verdict.
What we test next
- Phase-2 human calibration — a real culled shoot (~150+ frames) with actual photographer keep/reject decisions, replacing the 35B reference as ground truth for the quality bars and feeding the 3.0 taste layer its first human labels.
- The observational lanes — the ten photograph sets (bursts, deliberate blur, mixed lighting, fine detail, documentary ambiguity, edge distractions, visible text, private material kept off-camera, purpose-split near-duplicates, and negative controls where “not enough evidence” is the right answer), scored for observation accuracy, hallucination, consistency, OCR, grounding, repeatability, and uncertainty calibration — the companion benchmark video’s material.
- Appliance service switch — the measured +60% rebuild passed its output-richness side-by-side (no richness cost; one proper-noun over-reach in twelve photos, noted in Limitations #5); the switch itself awaits the owner’s go.
- Separating Gemma’s failure from its stack — the cross-brand Gemma result is a measurement of one MLX build under one runtime; rerunning the same weights on a different serving path would establish whether the blindness belongs to the model or the integration.
- Blind human preference over descriptions (in progress, protocol pre-registered here before the picks were scored) — the reviewer sees each of the 86 photos with the candidate models’ descriptions as anonymous shuffled cards (no model names, no speeds) and picks the one they agree with most, plus an optional second; hallucinated catch-trial cards ride along on ten photos as a validity check, and a run where a catch card wins is flagged noisy rather than reported. One property of this set must be disclosed with the results: all lanes answered the same fixed benchmark prompt, so competent models converge — 83% of photos have a card pair at ≥0.55 text similarity (38% at ≥0.70), and on those the residual difference is mostly register (formal vs. casual phrasing), not content. The scorer therefore treats a first+second pick pair at ≥0.70 similarity as a co-first — half a first-pick credit each, no head-to-head manufactured between the twins — and records the click order separately as a register preference, which is a style signal the production prompt template can pin, not a quality verdict. Win shares carry Wilson 95% intervals; a statistical tie between the top models resolves by measured speed, a rule fixed before scoring.
Two items from the v1.1 list have since landed in this edition: the cross-brand shootout itself, and the 8B non-thinking quality lane at n=86 (measured inside it).
There is no overall winner to crown from a single aggregate number, and this paper doesn’t. The winners get named by job — best local default, best low-memory, best burst comparison, best OCR, best grounded explanation, best uncertainty behavior, best unconstrained quality — as each lane lands.
Reproducibility
Every number in the measured campaign sections — throughput, backend, reliability, and
quality — is re-derivable from raw per-request JSON records in docs/research/
of the LrForge repository:
pop_matrix_results.json          pop_combined_512.json
pop_sustained_30min.json         pop_reference_86.json
2026-07-13_jetson-bart-BENCHMARK-raw.json
soak_results_part1.json          soak_results.json
specdecode_ab.json               mac_matrix_results.json
mac_combined_512.json            mac_quality_49.json
lmstudio_8b_results.json         lmstudio_4b_results.json
lmstudio_4b_quality_49.json      bart_quality_86.json
mac4b_quality_86.json            richness_old.json
richness_master.json
# cross-brand lanes
crossbrand_qwen3-vl-8b_86.json   crossbrand_qwen2.5-vl-7b_86.json
crossbrand_kimi-vl-a3b_86.json   crossbrand_gemma-4-26b-a4b_86.json
The figures are generated from those files, not hand-drawn:
docs/research/figures/make_figures.py. The cross-brand lanes were driven by
tools/crossbrand_bench.py and scored with tools/crossbrand_quality.py
(bootstrap, 2,000 resamples, seed 7); the Gemma row combines the strict-parsed and
regex-salvaged score fields present in its raw file, as disclosed where it appears. The
campaign log with full context is docs/research/2026-07-13_jetson-bart-BENCHMARK-RESULTS.md.
The blind human-preference study (What we test next, #5) is likewise re-derivable:
tools/blind_review_build.py (seeded shuffle, seed in the manifest),
docs/research/blind_review/blind_manifest.json (card→model key, never shown
to the reviewer), and tools/blind_review_score.py (co-first similarity rule,
Wilson intervals, pre-registered speed tie-break).
The exceptions — numbers quoted in this paper whose per-request raw records are not in that set — are these, so a reader auditing the raw does not have to discover them:
- The appliance’s n=49 quality pairs and its per-process memory snapshots exist in the campaign log but their per-photo raw records were not retained, so Figure 2 draws no confidence interval for that one point.
- The deterministic pre-pass timings (~15 images/s dedupe, ~23 images/s face analysis, ~108 ms/photo combined) and the appliance’s 12.5 s service-restart recovery are campaign-log figures with no retained per-request timing file.
-
The Ollama no-thinking switch probes (
think:false,reasoning_effort:none,/no_think): the retained raw carries LM Studio’s probe records (lmstudio_8b_results.json,thinkingblock) and a_meta“thinking-always model” note on the Ollama side, but the three-switch experiment’s own request records were not retained. - The “Beyond scoring” engine-capability numbers (taste, develop, and overnight lanes) come from the separate end-to-end validation reports, not from this benchmark’s raw set — they are architecture proofs, flagged as such where they appear.
Appendix A — machine spec sheets
Exact configurations of the three machines behind every number in this paper, captured live from each box on 2026-07-14. “As served” means the model file the inference server actually reported, not the marketing name.
Desktop GPU tier — “Pop”
| OS | Pop!_OS 24.04 LTS (Linux kernel 6.18.7) |
| CPU | AMD Ryzen 7 7800X3D (8 cores) |
| System RAM | 32 GB |
| GPU | NVIDIA GeForce RTX 5070 Ti, 16 GB VRAM (driver 580.159.03) |
| Inference server | llama.cpp (llama-server), single slot (-np 1), one request in flight |
| Model as served | Qwen3.6-35B-A3B-UD-Q4_K_M.gguf (multimodal) |
Appliance tier — “bart”
| Device | NVIDIA Jetson Orin Nano Developer Kit Super, $249 |
| Power mode | MAXN_SUPER, ≤18.3 W measured at the wall input rail (VDD_IN) |
| RAM | 8 GB unified (7.55 GB usable) |
| OS / stack | JetPack 7.2 (L4T R39.2.0, kernel 6.8.12-tegra), CUDA 13.2 |
| Inference server | llama.cpp master cb489bc (ARM64 + sm_87, FA on, ctx 8192, reasoning disabled via chat-template kwargs) — switched from fork bc05a68 on 2026-07-14 after the A/B (+60%) and description-richness verification; most measured appliance lanes in this paper ran on the fork and say so where quoted |
| Model as served | Qwen3.5-4B-Q4_K_M.gguf + mmproj-Qwen3.5-4B-F16.gguf vision projector |
Laptop tier — “Mac”
| Machine | MacBook Pro, Apple M1 Max, 32 GB unified memory |
| OS | macOS 26.3.1 |
| Backends measured | Ollama 0.20.0 and LM Studio (CLI build efce996); MLX and GGUF runtimes as shipped by each |
| Models as served | qwen3-vl:8b (Ollama library build, thinking-always) · Qwen3-VL 8B/4B, Qwen2.5-VL-7B, Kimi-VL-A3B, Gemma 4 26B-A4B (LM Studio catalog builds) |
Two notes for anyone reproducing: the desktop and laptop have the same 32 GB of system memory — the tier difference is the dedicated GPU and its VRAM, not the host; and every lane in this paper ran with strictly one request in flight, so none of these numbers depend on batching or parallelism.
Sources and further reading
Current model sources
- Google AI for Developers, “Gemma 4 model overview” and release documentation: ai.google.dev/gemma/docs/core and ai.google.dev/gemma/docs/releases
- Qwen official Qwen3.5 collection: huggingface.co/collections/Qwen/qwen35
- Qwen official Qwen3-VL repository and collection: github.com/QwenLM/Qwen3-VL and huggingface.co/collections/Qwen/qwen3-vl
- OpenBMB, MiniCPM-V official repository and MiniCPM-V 4.6 model card: github.com/OpenBMB/MiniCPM-V and huggingface.co/openbmb/MiniCPM-V-4.6
- Microsoft, Phi-4-Reasoning-Vision-15B model card: huggingface.co/microsoft/Phi-4-reasoning-vision-15B
- Ai2, Molmo 2 overview and repository: allenai.org/blog/molmo2 and github.com/allenai/molmo2
- OpenGVLab, InternVL3.5 overview and repository: internvl.github.io/blog/2025-08-26-InternVL-3.5 and github.com/OpenGVLab/InternVL
- Meta, Llama 4 multimodal announcement: ai.meta.com/blog/llama-4-multimodal-intelligence
- Hugging Face, SmolVLM overview: huggingface.co/blog/smolvlm
Accessible explanations
- Hugging Face, “Vision Language Models Explained”: huggingface.co/blog/vlms
- IBM, “What Are Vision Language Models?”: ibm.com/think/topics/vision-language-models
- NVIDIA, “Vision Language Model Prompt Engineering Guide for Image and Video Understanding”: developer.nvidia.com/blog/vision-language-model-prompt-engineering-guide-for-image-and-video-understanding
- Google Cloud, multimodal generative AI search explainer: cloud.google.com/blog/products/ai-machine-learning/multimodal-generative-ai-search
- “An Introduction to Vision-Language Modeling,” arXiv 2405.17247: arxiv.org/abs/2405.17247
Local runtime context
- MLX-VLM official repository: github.com/Blaizzy/mlx-vlm
- Ollama MiniCPM-V 4.6 library entry: ollama.com/library/minicpm-v4.6
Research note
Model families, runtime support, licenses, and quantizations change quickly. The model-field roster reflects sources checked on July 11, 2026; all measurements were taken July 13–14, 2026 on the specific builds, quantizations, and backends named in the campaign log. “Current” does not mean “supported by LrForge,” a model-card claim is not treated as proof of Lightroom workflow performance, and — as this campaign demonstrated — a measurement of a model is always a measurement of the model as served.